Posts

Invest In Which Company ?

Image
The main issue with the new traders is of finding sound companies to invest in. You may have heart about fundamental analysis & technical analysis. The fundamental analysis help you to select five to six and chart reading (technical analysis) helps you identifying buying & selling time of stock. Fundamental analysis is the process of clarify the basics of business or fundamental financial level. This type of analysis examines key ratios of a business to determine its financial health and gives you an idea about actual valuation of stock & business. Apply the following simple criteria to the list of top 100 companies, you find that it will reduce your list of companies to a dozen or so. Now it will be easy to observe this list to get accurate entry / exit time in stock with the help of technical analysis. Market Capitalization: Eliminates very small companies, or penny stocks your list & look for the company with the market capitalization of more t
Story Of Market

Image
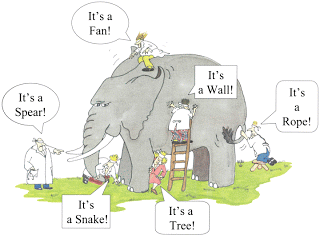
Three blind men encountering an elephant. "It's a tree," says one, stroking a leg. "No, no, it's a snake," says another, feeling the trunk. "No, this must be a house," insists a third, spreading his arms against the bulk of the elephant's body. All three had a different perception of the elephant based on the part they examined, and all three conclusions were wrong. The elephant was larger and more complex than any of the men realized. Every one have different perception & this human nature create the market. The Bear saw a fall in market as a great vindication of his view and recovery of his position. The Bull saw the action as a short pullback to add to or enter a long position. Every buyer & seller in the market think, he is right & make money………But only few of them are winner those who control their EMOTIONS, maintain DISCIPLINE & treat trading as a SCIENCE + ART. Try to be a winner……….But step by step…….All the b

INTRODUCTION TO CANDLE CHART - PRAT ONE

Image
Introduction to candlesticks Candle Sticks analysis was developed by Japanese in 17th Century to trade rice. For a candlestick chart, the open, high, low and close are all required. A daily candlestick is based on the open price, the intraday high and low, and the close. candlestick charts have become quite popular in recent years because :  It is easy to understand  Provide earlier indications of market turns so it will help us to enter & exit the market with better timing.  Reading candle chart with other indicators give us a better understanding about the market condition. CONSTRUCTION OF CANDLE STICKS In order to create a candlestick chart, you must have a data set that contains open, high, low and close values for each time period you want to display. The hollow or filled portion of the candlestick is called "the body". The long thin lines above and below the body represent the high/low range and are called "shadows". If the close is lower than the open

Types Of Analysis

Image
FUNDAMENTAL ANALYSIS AND TECHNICAL ANALYSIS BOTH ARE COMPLMENTRY OF EACH OTHER Fundamental analysis consider a corporation’s financial data where as technician analysis uses charts and study price movements and trading volumes to determine patterns. We should apply both fundamental & technical analysis together to make our investment / trading more successful. Fundamental analysis help us to find out the stock in which we invest & technical analysis tell us about the best time to enter into an undervalued stock. By improving our entry time, we increase our gain on investment. Fundamental analysis Fundamental analysis looks at financial & economic factors, known as fundamentals which may influence the viability of a company. fundamental analysis often looks at data over a number of years & takes a relatively long-term approach to analyzing the market compared to technical analysis. Fundamental analysis examines the financial statement, present capacity & future expan

Some thing about Warren Buffet

Image
All successful people in stock market have some similar qualities so as a trader / investor we should know some thing about them also. Warren Buffet – The most successful investor. The thing Buffet hates the most is losing money. One time he went golfing with some friends in California. The group offered Buffet a bet: his $10 against their $20,000 that he couldn't score a hole in one over the next three days. He didn't agree to participate in the challenge. He told his friends that after careful consideration, he concluded that it wasn't a good bet for him. He mentioned that their offer is like a lottery ticket - a very small entry price and close to zero chance to win. If you let yourself be undisciplined on the small things, you'd probably be undisciplined on the large things too. Following are some very interesting aspects of his life from an interview on CNBC 1. He bought his first share at age 11 and he now regrets that he started too late! Things were very cheap

Stock Market – Tips for Beginners

As a beginner, you must understand two things – firstly never try to get rich in a day by doing over trading, Secondly trading is not a hobby but a very competitive business. So we have to control our emotions during trading & Also have some basic understanding about the terms used in Stock Market. Warren Buffett has suggested that every investor should be able to understand basic accountancy principles, an annual report and stock market history. You probably do not need to become an accountant, but being able to understand the scoring system of the game can only help. We must check some basic informations about the company before investing in it 1. P/E Ratio (Price-To-Earnings Ratio) :- P/E Ratio of a stock is a measure of the price paid for a share relative to the annual income or profit earned by the firm per share. A high P/E Ratio indicates that the share price is high relative to its current earning power. Possibly indicating that the stock is overvalued & a fall mi