Types Of Analysis

FUNDAMENTAL ANALYSIS AND TECHNICAL ANALYSIS
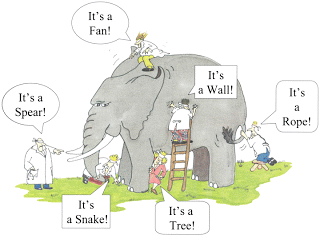
BOTH ARE COMPLMENTRY OF EACH OTHER
Fundamental analysis consider a corporation’s financial data where as technician analysis uses charts and study price movements and trading volumes to determine patterns.
We should apply both fundamental & technical analysis together to make our investment / trading more successful. Fundamental analysis help us to find out the stock in which we invest & technical analysis tell us about the best time to enter into an undervalued stock. By improving our entry time, we increase our gain on investment.
Fundamental analysis
Fundamental analysis looks at financial & economic factors, known as fundamentals which may influence the viability of a company. fundamental analysis often looks at data over a number of years & takes a relatively long-term approach to analyzing the market compared to technical analysis.
Fundamental analysis examines the financial statement, present capacity & future expansion plans which gives you an idea of the value its stock & ratios analysis of a business to determine its financial health. The key ratios of fundamental analysis (as discussed in earlier blogs) are Earnings per Share (EPS), Price to Earning Ratio (P/E Ratio), Projected Earning Growth (PEG), Price to Sell (P/S), Price to Book (P/B), Dividend Payout Ratio, Dividend Yield, Book Value, Return on Equity.
Technical Analysis
Technical analysts study trading histories to identify price trends in particular stocks, mutual funds, commodities, or options in specific market sectors or in the overall financial markets. They use their findings to predict probable, often short-term, trading patterns in the investments that they study. Technical Analysis supposes markets have memory. If so, past prices, or the current price momentum, can give an idea of the future price evolution.
Technical analysis has become increasingly popular over the past several years, as more and more people believe that the historical performance of a stock is a strong indication of future performance. The use of past performance should come as no surprise. People using fundamental analysis have always looked at the past performance of companies by comparing fiscal data from previous quarters and years to determine future growth. The difference lies in the technical analyst’s belief that securities move according to very predictable trends and patterns. These trends continue until something happens to change the trend, and until this change occurs, price levels are predictable.
There are many instances of investors successfully trading a security using only their knowledge of the security’s chart, without even understanding what the company does. However, although technical analysis is a terrific tool, most agree it is much more effective when used in combination with fundamental analysis.
If you have something in this regards do share it with me, in next blog we will discuss about the CANDLE CHART which is an important part of Technical Analysis.


Comments
Post a Comment